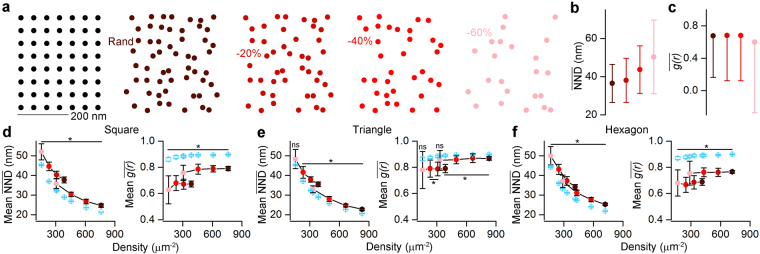
Figure 2.
Assessing the effectiveness of the NND and ACF on distinguishing uniform patterns from random distributions. (a) Point patterns are generated by randomizing the localization points of a uniform squared grid (two leftmost panels, see Methods). Different labeling efficiencies are modelled by randomly taking away 0%, 20%, 40% and 60% (from left to right) of the localizations points. The 100% ‘labeling efficiency’ has an overall density of 387 μm−2. (b,c) (b) and (c) values show weak dependency with the ‘labeling efficiency’. (d) Population level comparison of squared uniform patterns (n = 20) and their corresponding randomizations with (left) and (right). To cover the previously tested localization point density range, the initial full patterns had a density of either ~400 μm−2 (e.g. Rand in a) or ~800 μm−2. The point pattern distributions originating from the two full patterns are marked by the connected dots (e,f) Same as in d, but for triangular (e) and hexagonal (f) patterns. The color-coding in b–f corresponds to the different ‘labeling efficiency’ cases as shown in a. Blue symbols represent random distributions. Data are presented as mean ± SD. Wilcoxon signed-rank test was used for statistical comparison. *Indicates Bonferroni corrected p < 0.00625.

