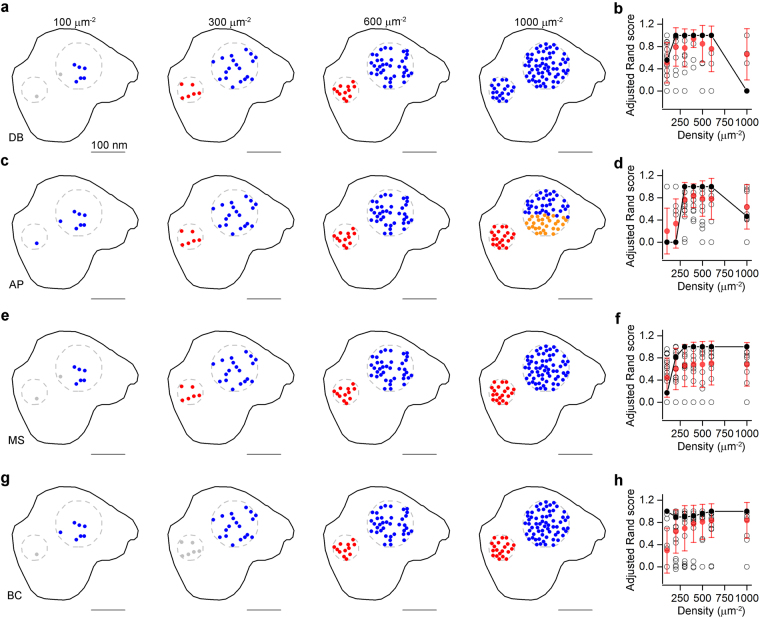
Figure 3.
Evaluating the performance of different clustering algorithms. (a) Performance of DBSCAN (DB) on a modeled clustered distribution (cluster density: 30 μm−2) with different localization point densities. Dashed grey circles demarcate the areas within which the localizations points were randomly distributed. Localization points are color-coded based on their cluster assignment (grey points represent noise). (b) Adjusted Rand scores (ARS) computed from 20 different SDPs. (c–h) Same as in a and b, but for the affinity propagation (AP, c,d), mean shift (MS, e, f), and Bayesian clustering (BC, g,h) algorithms. Open black symbols correspond to individual SDPs (n = 20), solid black symbols are the ARS values of the examples shown on the left, red symbols represent mean ± SD.

