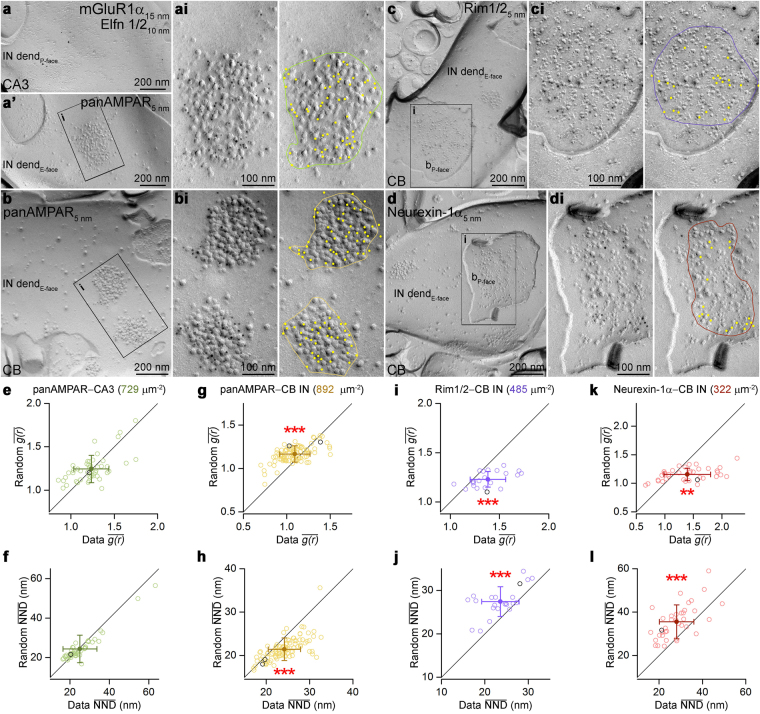
Figure 4.
Sub-synaptic distributions of various synaptic proteins. (a,a’) Mirror replica images of a dendritic plasma membrane segment double labeled for mGluR1α and Elfn1/2 on the protoplasmic-face (P-face), and for AMPARs (using a pan-AMPA antibody) on the complementary exoplasmic-face (E-face) in the stratum oriens of the hippocampal CA3 area. (ai) High magnification view of boxed area in a’ showing a postsynaptic area (PSD) indicated by a dense cluster of intramembrane particles (IMPs) intensely labeled for AMPARs. (b) Immunogold labeling for AMPARs on molecular layer interneurons (INs) of the cerebellum (CB). (bi) Two PSDs are shown at higher magnification. (c,d) CB IN dendritic E-face membranes (IN dend) are contacted by bouton P-face membranes that show strong Rim1/2 (c) and Neurexin-1α (d) immunoreactivity in their active zones (AZs). (ci,di) High magnification images of the boxed areas in c and d. On the right panels, the colored lines illustrate the border of the PSDs (ai,bi) and AZs (ci,di) with the yellow dots highlighting gold particles. (e,f) Comparison of the (e) and (f) values obtained from the AMPAR labeling of PSDs of CA3 mGluR1α-positive INs (n = 48 and 49 PSDs, respectively) with random distributions (n = 200 random for each PSD). (g–l) Same as in e and f, but for AMPAR (g,h, n = 95 and 97, respectively), Rim1/2 (i,j, n = 22) and Neurexin-1α (k,l, n = 37) labeling in CB IN synapses. Open circles correspond to individual PSDs or AZs; the examples shown in panels a–d are indicated by the black symbols. Filled symbols represent the mean ± SD. Wilcoxon signed-rank test was used for statistical comparison. **Indicates p < 0.01 and ***indicates p < 0.001. b, bouton; dend, dendrite.

