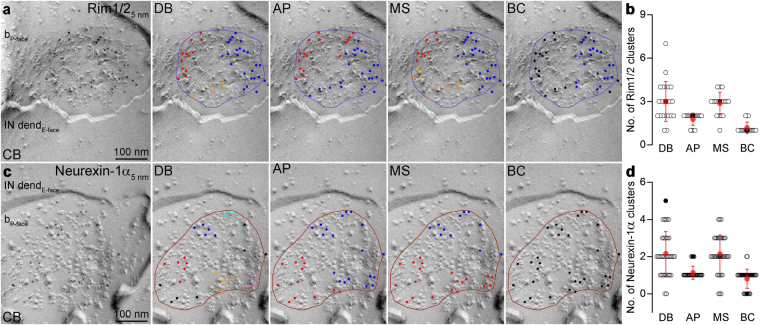
Figure 5.
Number of Rim1/2 and Neurexin-1α clusters detected with different clustering algorithms. (a) Example for a Rim1/2 decorated IN targeting AZ from the molecular layer of the CB. Panels show the cluster-assignment of gold particles by DB, AP, MS and BC algorithm (different colors represent different clusters, black illustrates noise). (b) Number of Rim1/2 clusters detected by the different clustering algorithms. Open circles indicate individual AZs (n = 22 AZs), red symbols represent the mean ± SD. The black filled circles correspond to the AZ shown in a. (c,d) Same as in a and b, respectively, but for Neurexin-1α (n = 37 individual AZs).

