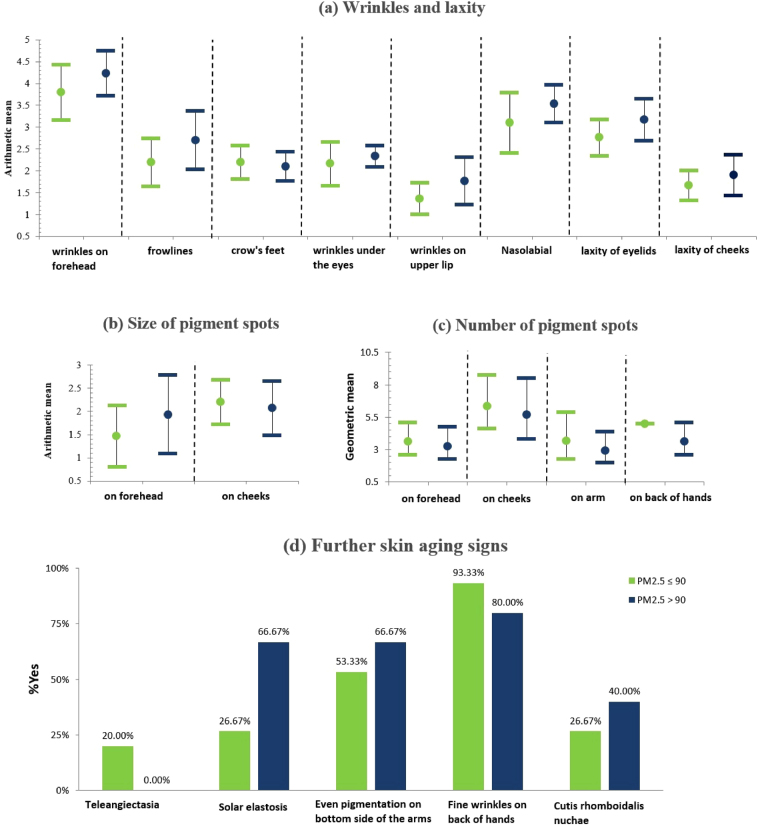
Figure 1.
Description of skin aging signs in high indoor PM2.5 exposure group and low indoor PM2.5 exposure group in the directly measured samples. The study directly measured the indoor PM2.5 of 30 households, and divided them into high PM2.5 exposure group (N = 15, annual mean exposure >90 µg/m3) and low PM2.5 exposure group (N = 15, annual mean exposure ≤90 µg/m3). The wrinkles, laxity and size of pigment spots are normally distributed, and therefore arithmetic means (AM) is given; while number of pigment spots is log-normally distributed, and therefore geometric means (GM) is given. 95% CI is presented. Further skin aging manifestations are presented as occurrence respectively.

