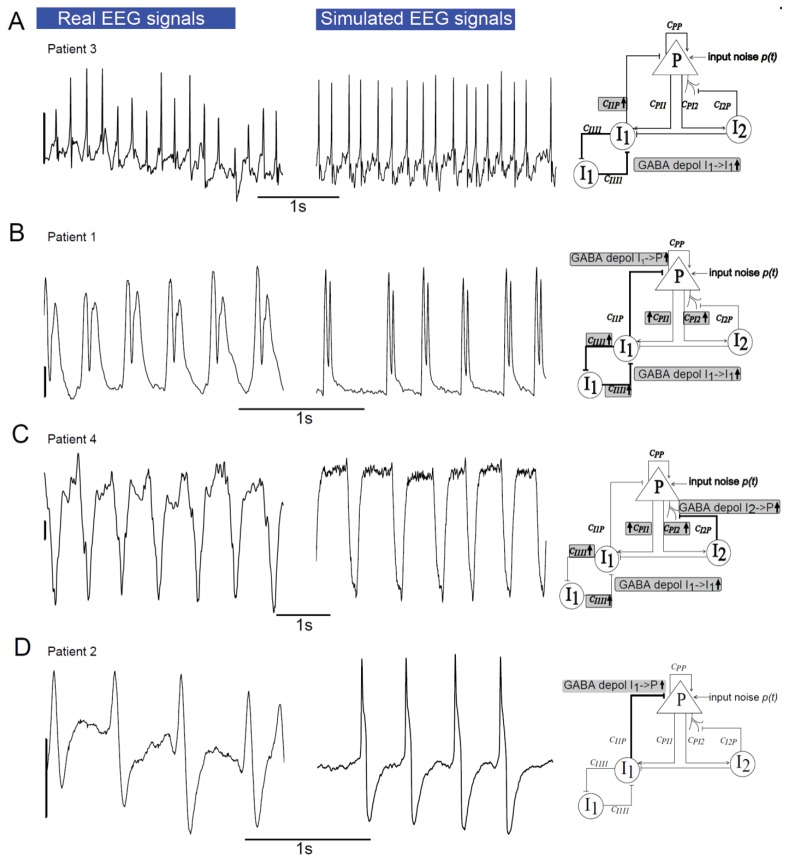
Fig 4. Comparison of simulated and real ictal epileptic patterns from Dravet syndrome patients.
Different types of real ictal activity recorded in DS children (left column) and comparison with ictal activity produced by the model (middle column). Right column shows neuronal population model schemes with gray rectangles, indicating the parameters of the model that were changed comparing to ‘parameters of base’ (Table 1). Scale bar: 200 μV.

