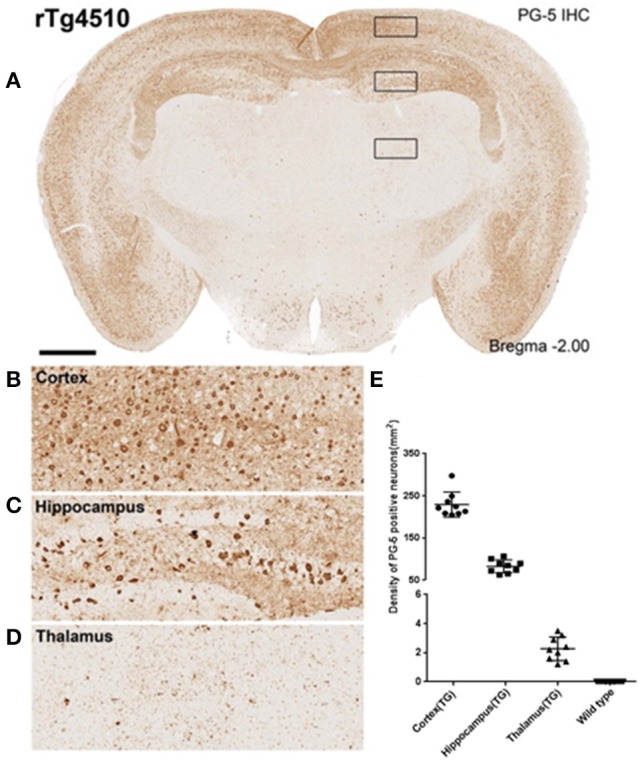
Figure 2.

Immunohistochemistry to estimate regional PG-5 positive NFT density. (A) Single slice from a representative rTg4510 mouse with staining for PG-5 positive NFTs. Marked regional dependence of NFT density is observable [see inset (B–D) for examples of cortical (B), hippocampal (C), and thalamic (D) NFT distribution]. (E) Quantitative regional estimates of NFT density for each of the 16 WT and 9 TG mice that underwent MRI (8.5 month age).
