Figure 8.

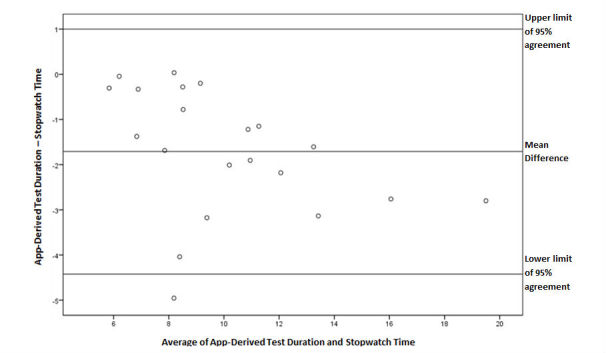
A Bland-Altman plot of differences between app-derived test duration and stopwatch time during the Stair Climb Test. Line of mean difference is at -1.71 and upper and lower limits of 95% agreement are at 1.00 and -4.42, respectively.

A Bland-Altman plot of differences between app-derived test duration and stopwatch time during the Stair Climb Test. Line of mean difference is at -1.71 and upper and lower limits of 95% agreement are at 1.00 and -4.42, respectively.