Figure 1.
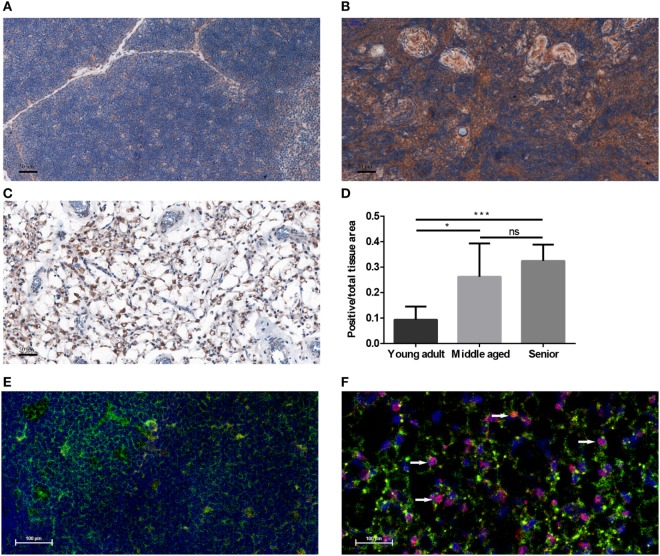
PPARgamma expression in the adult thymus. Human formalin-fixed, paraffin-embedded (FFPE) thymic sections were analyzed for PPARgamma expression by immunohistochemistry in age groups of 20–30 years called young adult (A), 50–60 years called middle-aged (B), and 70–80 years called senior (C). Brown color reaction (DAB) shows PPARgamma expression. Blue color (hematoxylin) shows nuclear counter-stain and defines total cellular areas. The ratio of PPARgamma-expressing cellular areas and total cellular areas is also shown for the different age groups (D). Immunofluorescent staining is also shown for mouse at 1 month of age called young adult and at 15 months of age called senior (E,F). Green color shows epithelial cells (anti-EpCAM1-FITC), red color shows preadipocytes (anti-PPARgamma primary AB with Alexa-555 secondary AB) and blue color defines nuclei (DAPI counter-stain). Note arrowheads pointing at double-staining (EpCAM-1+/PPARgamma+) cells (F). Both stainings show expected patterns: EpCAM-1 staining presents cell surface markers, while PPARgamma-staining shows nuclear localization (observed in magenta color due to overlap with DAPI nuclear counterstain on Figure 1F). For exact numerical data, refer to Supplementary Material. Significant differences are shown by asterisks (ns for not significant, * for p ≤ 0.05, ** for p ≤ 0.01, *** for p ≤ 0.001).

