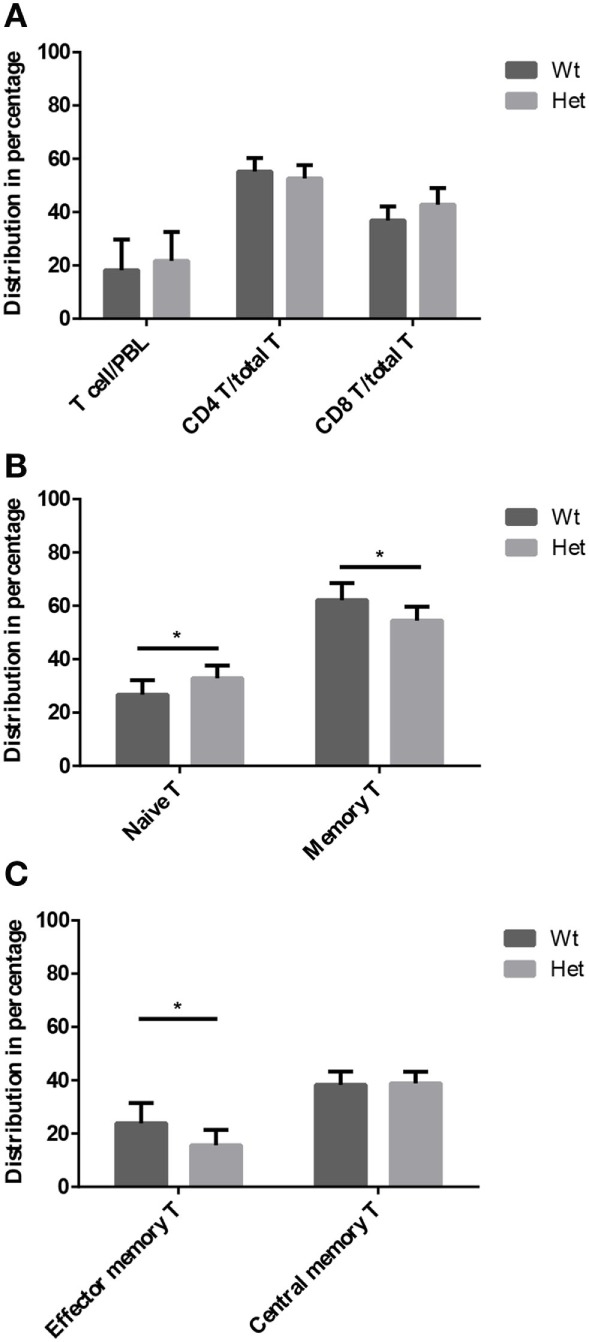
Figure 4.

T-cell subpopulations in adult peripheral blood. Peripheral blood T-cell subpopulations were evaluated by flow-cytometry at 12 months of age in wild-type and PPARgamma heterozygous animals (KO animals decease by this age). Percent distribution of T-cells (CD3+), helper T-cells (CD3+, CD4+), and cytotoxic T-cells (CD3+, CD8+) is shown by (A). Also, the percent distribution of naive T-cells (CD3+, CD44−, CD62L+) and memory T-cells (CD3+, CD44+, CD62L+/−) was evaluated within the CD3-gate of T-cells (B). Further analysis of memory T-cell subpopulation shows percent distribution of effector memory T-cells (CD3+, CD44+, CD62L−) and central memory T-cells (CD3+, CD44+, CD62L+) within the CD3-gate of T-cells (C). For the measurement of every sample, 100,000 cells were stained and 10,000 events (parent R1 morphological lymphocyte gate) were recorded by flow-cytometry. For exact cell numbers, refer to Supplementary Material. Significant differences are shown by asterisks (ns for not significant, * for p ≤ 0.05, ** for p ≤ 0.01, *** for p ≤ 0.001).
