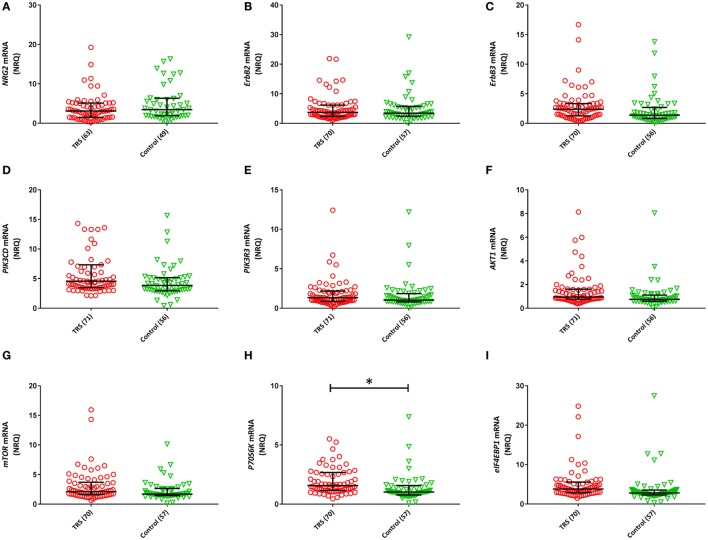
Figure 2.
Normalized relative quantities (NRQ) of the gene transcripts: (A) NRG2 [treatment-resistant schizophrenia (TRS): 3.11, interquartile range (IQR) = 1.5–5.12, controls: 3.44, IQR = 1.89–6.34; F1, 111 = 0.524, P = 0.113]; (B) ErbB2 (TRS: 3.72, IQR = 2.39–6.19, controls: 3.44, IQR = 2.42–5.73; Wald χ2 = 0.029, P = 0.864); (C) ErbB3 (TRS: 2.39, IQR = 1.26–3.35, controls: 1.38, IQR = 0.82–2.70; F1, 126 = 4.071, P = 0.083); (D) PIK3CD (TRS: 4.57, IRQ = 3.45–7.34, controls: 3.86, IQR = 2.94–5.16; Wald χ2 = 4.464, P = 0.079); (E) PIK3R3 (TRS: 1.34, IQR = 0.86–2.17, controls: 1.02, IQR = 0.8–1.85; Wald χ2 = 0.104, P = 0.84); (F) AKT1 (TRS: 0.94, IQR = 0.75–1.61, controls: 0.75, IQR = 0.59–1.11; Wald χ2 = 5.605, P = 0.054); (G) mTOR (TRS: 2.10, IQR = 1.66–3.69, controls: 1.44, IQR = 1.44–2.65; Wald χ2 = 4.746, P = 0.20); (H) P70S6K (TRS: 1.57, IQR = 1.16–2.68, controls: 1.02, IQR = 0.77–1.58; Wald χ2 = 13.90, P = 0.018); (I) eIF4EBP1 (TRS: 3.81, IQR = 2.88–5.58, controls: 2.80, IQR = 2.30–3.55; Wald χ2 = 8.71, P = 0.054). Error bars represent median with interquartile range. Benjamini–Hochberg adjusted P-values are shown (*P < 0.05).

