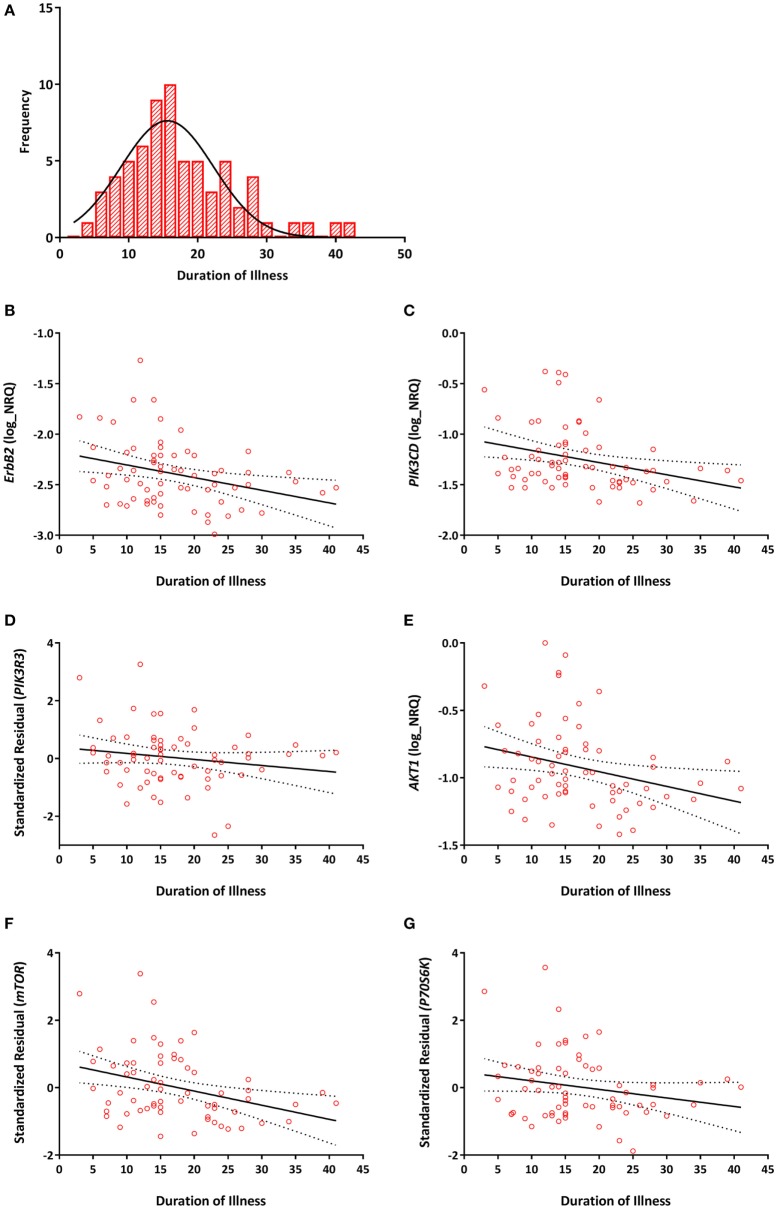
Figure 3.
(A) Distribution of duration of illness in years (mean = 17, SD = 8). Correlations between duration of illness and (B) ErbB2 (r = −0.293, PB–H = 0.031); (C) PIK3CD (r = −0.303, PB–H = 0.031); (D) PIK3R3 (r = −0.275, PB–H = 0.038); (E) AKT1 (r = −0.290, PB–H = 0.031); (F) mTOR (r = −0.339, PB–H = 0.023); (G) P70S6K (r = −0.347, PB–H = 0.023) mRNA expression. Expression of PIK3R3, mTOR, and P70S6K are represented as the standardized residual from a linear regression model after adjusting for potential confounds [i.e., age for PIK3R3, RNA integrity number (RIN) and smoking for mTOR, age, RIN and smoking for P70S6K]. Solid lines represent the line of best fit and dotted lines represents 95% confidence intervals for the line of best fit.

