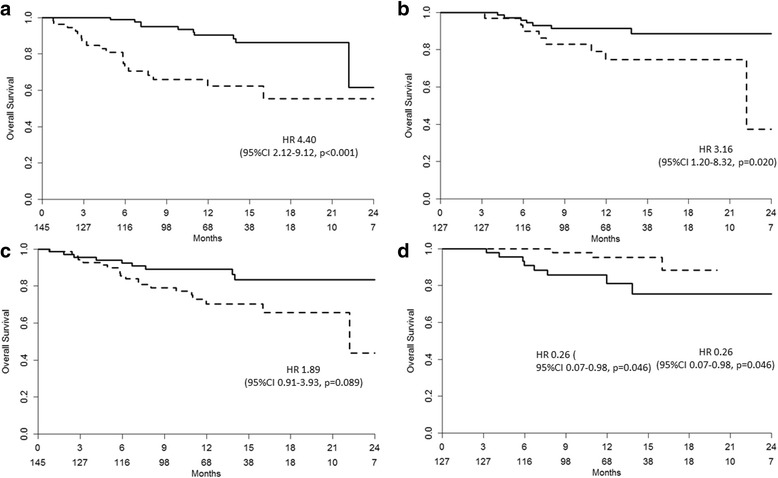
Fig. 3.

OS according to different clinical variables: a) Pain (solid line = no; dotted line = yes); b) patient satisfaction in patients with follow-up >3 months (solid line = satisfied + very satisfied; dotted line = worsened + not modified); c) baseline PSA (solid line = <17 ng/ml; dotted line = ≥17 ng/ml); d) 12w PSA decline in patients with follow-up >3 months (solid line = <50%; dotted line ≥50%)
