
Fig. 1.
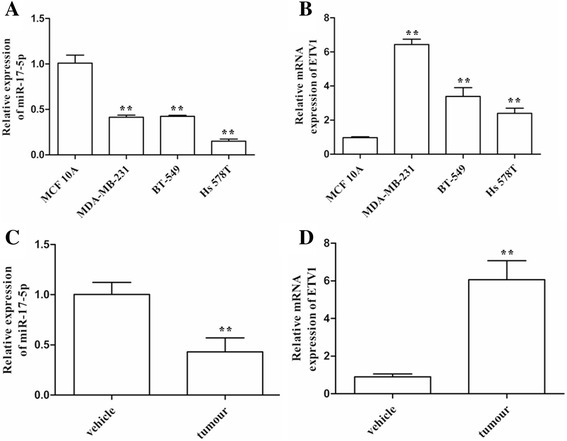
Features of miR-17-5p and ETV1 expression in TNBC cells and clinical samples. a, b, QRT-PCR analyses of miR-17-5p and ETV1 expression levels in TNBC cells. c, d, The expression levels of miR-17-5p and ETV1 in clinical TNBC samples evaluated by qRT-PCR. Data are expressed as the mean ± SEM of three independent experiments. **P < 0.01, compared with the control