Fig. 6.

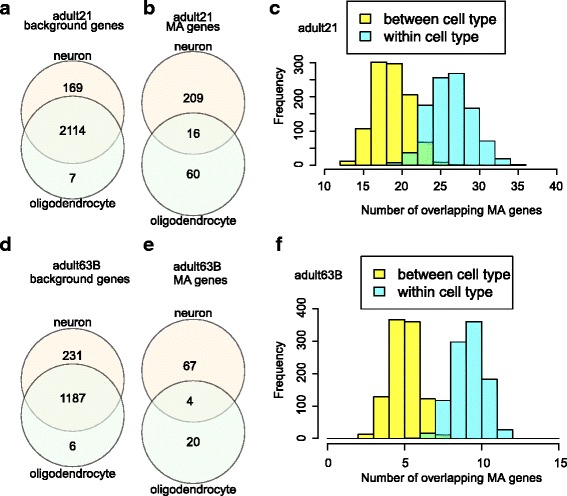
Cell type-specific expression of MA genes. Venn diagrams (a and b) show the overlaps of background and MA genes between two cell types (35 neurons and 12 oligodendrocytes) from adult21 brains. In histogram c, two non-overlapping groups of 12 neurons were randomly sampled 1000 times from the 35 adult21 neurons and the numbers of overlapping MA genes between the two groups was shown in light blue histogram (within-cell type comparison); the numbers of overlapping MA genes between 12 sampled neurons and the 12 oligodendrocytes in adult 21 brains was shown in yellow histogram (between-cell type comparison). The mean values of the two groups are significantly different (t-test, p < 2.2e-16). Panels d, e (18 neurons and 9 oligodendrocytes) and f (t-test, p < 2.2e-16) are for adult63B brains
