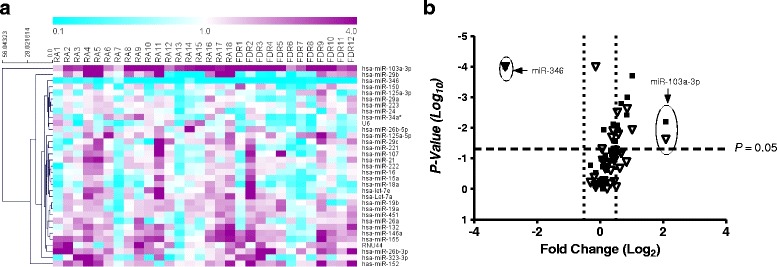
Fig. 1.

a Unsupervised hierarchical clustering generated using fold change expression values of microRNAs (miRNAs, miRs) analyzed in patients with rheumatoid arthritis (RA) and first-degree relatives (FDRs) compared with healthy control subjects. Color scheme: Violet = increased expression; cyan = decreased expression; and white = unchanged. b Volcano plot showing expression of 33 miRNAs in the whole blood of patients with RA (closed squares) and FDRs (open triangles). The miRNAs that are significantly altered in both groups are located above the horizontal dashed line corresponding to P ≤ 0.05
