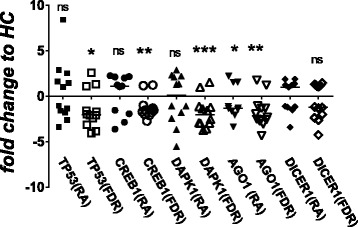
Fig. 4.

Transcript abundance of microRNA (miR) miR-103a-3p target messenger RNAs (DICER1, AGO1, CREB1, TP53, and DAPK1) analyzed by qPCR using total RNA obtained from whole blood of healthy control subjects (HCs), patients with rheumatoid arthritis (RA) and first-degree relatives (FDRs). Scatterplots represent relative fold change expression values compared with HCs. Error bars represent median values analyzed by Mann-Whitney U test. ***P < 0.001, ** P < 0.01, *P < 0.05. ns Nonsignificant compared with HCs
