
Fig. 5.
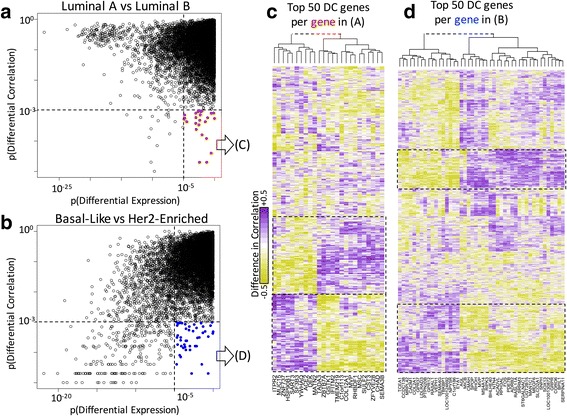
Analysis of specific subtypes in the TCGA breast cancer dataset. a Differential expression and correlation for the Luminal A and Luminal B comparison. The selected genes (in red) were further analyzed in panel (c). b Differential expression and correlation for the Basal-Like and Her2-Enriched comparison. The selected genes (in blue) were further analyzed in panel (d). c and (d) Genes whose difference in correlation is highest (in vertical) against the genes selected in (a) or (b) (in horizontal). Large network modules are framed by a dashed line. The difference of correlation is color-coded as shown in the left of (c) from −0.5 in greens to +0.5 in magentas. Genes in rows and columns were sorted according to hierarchical clustering using ward distance. The top trees were cut and joined by a dashed line for clarity