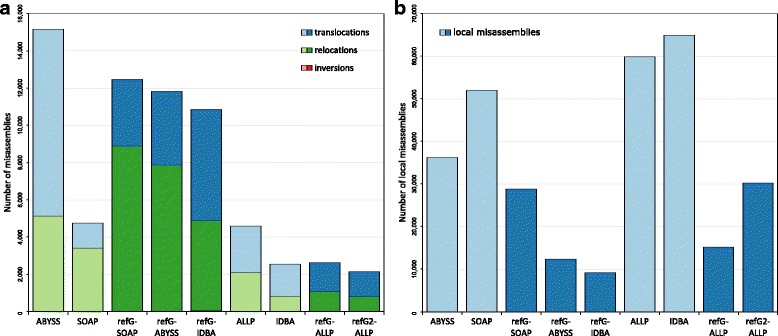
Fig. 4.

Number of misassemblies. Number of translocations (blue), relocations (green) and inversions (red) of the different assembly approaches are shown in (a). De novo assembly programs are shown in light colors and reference-guided de novo assembly approaches in dark colors (refG2 corresponds to the approach guided by the closer A. lyrata genome). Numbers of local misassemblies are shown in (b)
