
Fig. 2.
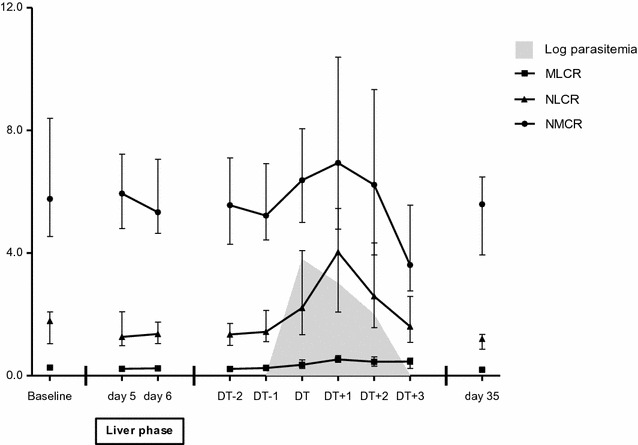
Changes in differential cell count ratios in the 20 subjects who developed malaria in CHMI-b. The data are shown as medians (dots) and interquartile ranges (whiskers). The data from DT − 2 until DT + 3 were synchronized on DT
Official websites use .gov
A
.gov website belongs to an official
government organization in the United States.
Secure .gov websites use HTTPS
A lock (
) or https:// means you've safely
connected to the .gov website. Share sensitive
information only on official, secure websites.
Changes in differential cell count ratios in the 20 subjects who developed malaria in CHMI-b. The data are shown as medians (dots) and interquartile ranges (whiskers). The data from DT − 2 until DT + 3 were synchronized on DT