
Fig. 3.
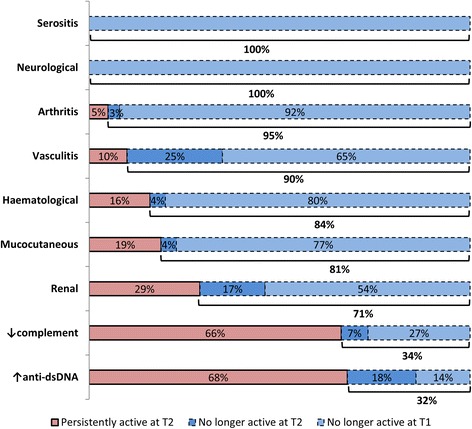
Frequency (percentage) of manifestations still identified at 18 months (T2) and respective remission rate. Purple, frequency (percentage) of manifestations recorded at T0 and still present at T2. Dark blue, manifestations that were in remission at 6 months (T1). Light blue, manifestations that were recorded as in remission for the first time at T2. Below the bars the global remission rate is reported