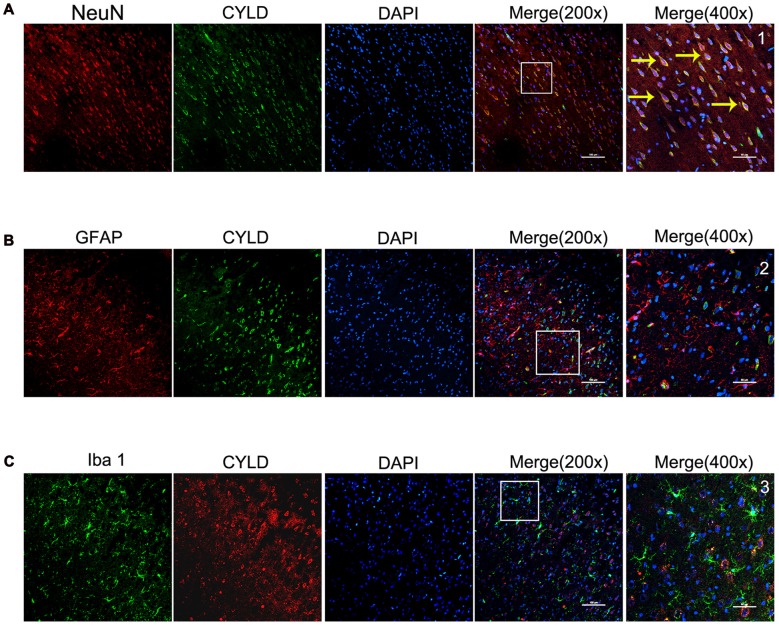
Figure 3.
Spatial distribution and cell type of CYLD ischemic cortical borders after 2 h of focal cerebral ischemia and 72 h of reperfusion, n = 6 (Scale bar = 100 μm). (A) Co-expression of CYLD (green) and NeuN (red, neurons). (B) Microglia co-expressing CYLD (green) and Iba1 (red, microglia). (C) Astrocytes co-expressing CYLD (green) and GFAP (red, astrocytes). 1–3 were magnified from a merged image and show CYLD. Yellow arrows indicate co-expression between CYLD and neurons (Scale bar = 50 μm).

