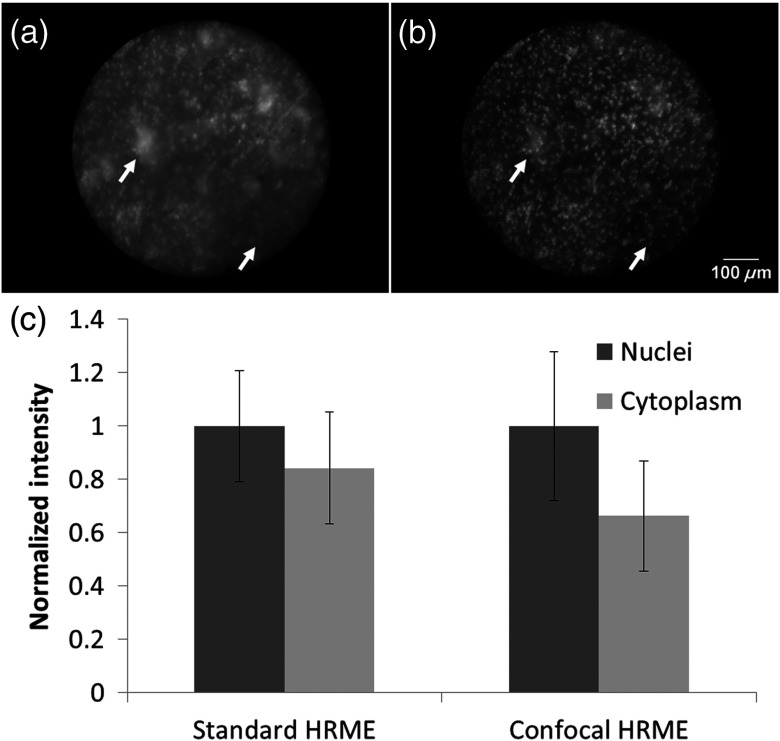
Fig. 5.
Ex vivo images of mouse squamous esophageal epithelium using (a) the standard and (b) confocal HRME. The confocal HRME resolved nuclei with enhanced contrast, especially in regions indicated by the arrows. (c) The normalized intensities of nuclear and cytoplasmic regions are shown; the error bars show the intensity standard deviation in these regions. The resulting ratio of the nuclear-to-cytoplasmic signal in the standard and confocal HRME was 1.19 and 1.51, respectively.

