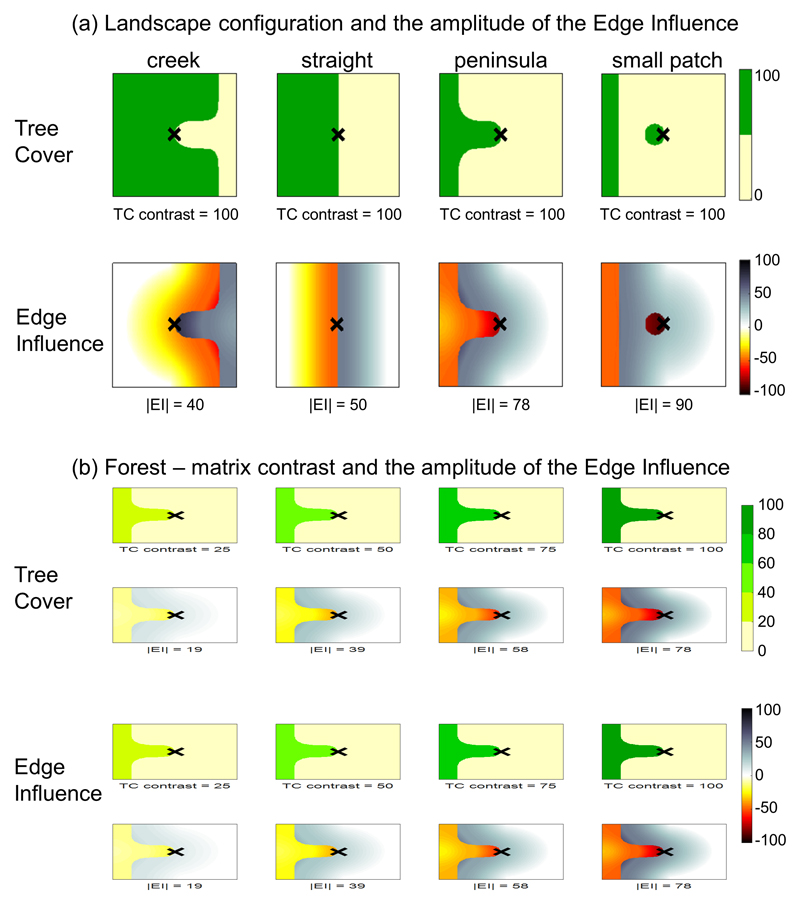
Extended Data, Fig. 5. Variations of Edge Influence (EI) with Tree Cover (TC) configuration (a) and contrast (b).
(a, top row) Four examples of landscape configurations comprising dense tree cover habitats (green) and matrix (cream). From left to right: creek edge, straight edge, peninsula edge and small forest patch. (a, bottom row) EI maps that correspond to above landscape configurations. The EI value at the central point (cross) is given for each configuration. The central point is always located on an edge and its distance to nearest edge is always zero. Nonetheless, EI increases in absolute value as the central point is increasingly surrounded by a different type of habitat. (b, top row) Four examples of peninsula edges between matrix (cream, TC=0%) and habitats of varying tree density (shades of green). From left to right: 25%, 50%, 75% and 100%. (b, bottom row) EI maps that correspond to above landscape contrasts. The EI value at the central point (cross) is given for each configuration. The central point is always located on an edge and its distance to nearest edge is always zero. EI increases as the edge contrast increases.

