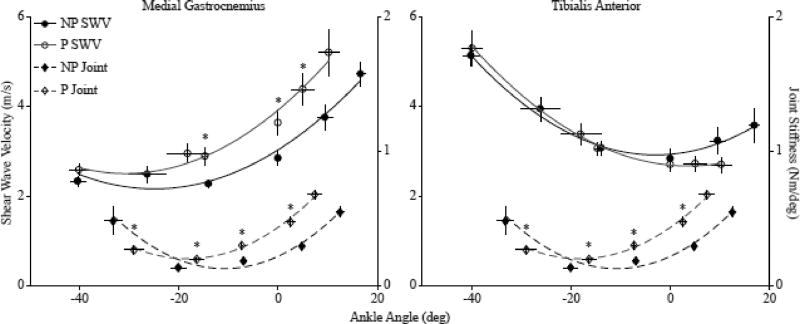
Fig. 2.
The relationships between shear wave velocity and ankle angle across all subjects (paretic, P-white circles; non-paretic, NP-black circles) for the medial gastrocnemius (left) and tibialis anterior (right). The relationship between joint stiffness and average ankle angle across all subjects (paretic, P- white triangles, non-paretic, NP- black triangles). The shear wave velocity, joint stiffness and ankle angle were averaged across all subjects at each position. The error bars are standard mean error. * P<0.05.

