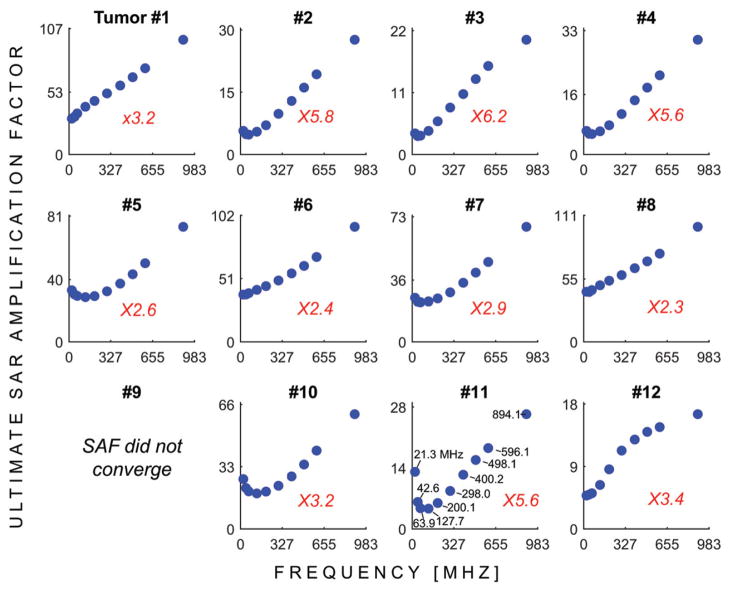
Figure 3.
USAFs as a function of the HT treatment frequency for tumours #1 through #12. The red numbers indicates, for each tumour location, the ratio of the highest to the lowest uSAF. In other words, this ratio indicates the expected improvement in SAF treatment efficacy by optimising the treatment frequency.

