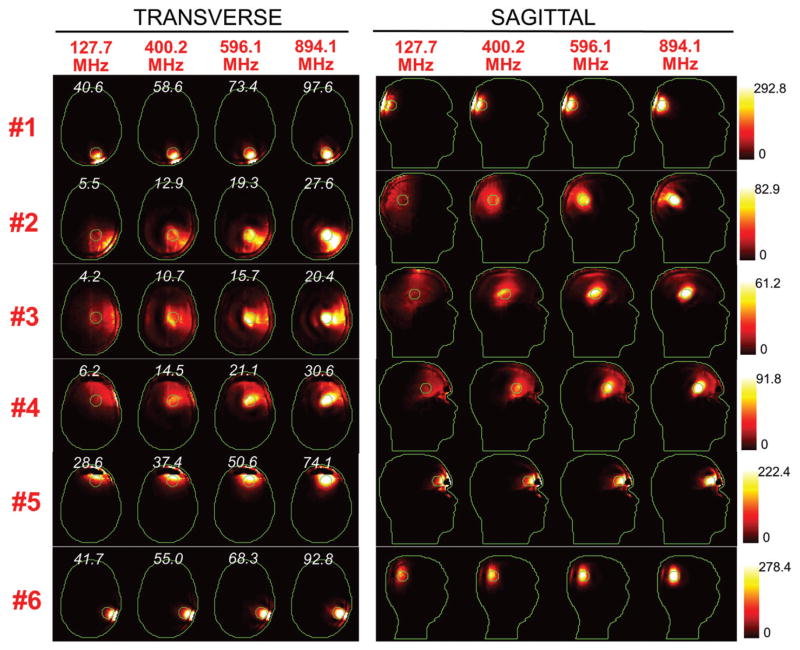
Figure 5.
SAR maps (in W/kg) associated to the uSAF HT treatment for tumours #3–#6 at frequencies 127.7, 400.2, 596.1 and 894.1 MHz in both the transverse and sagittal views. Contours of the head and the tumour are shown in green. The white numbers indicate the uSAF for each tumour location and frequency simulated. USAFs are computed for the whole head and are, therefore, the same for the transverse and sagittal views.

