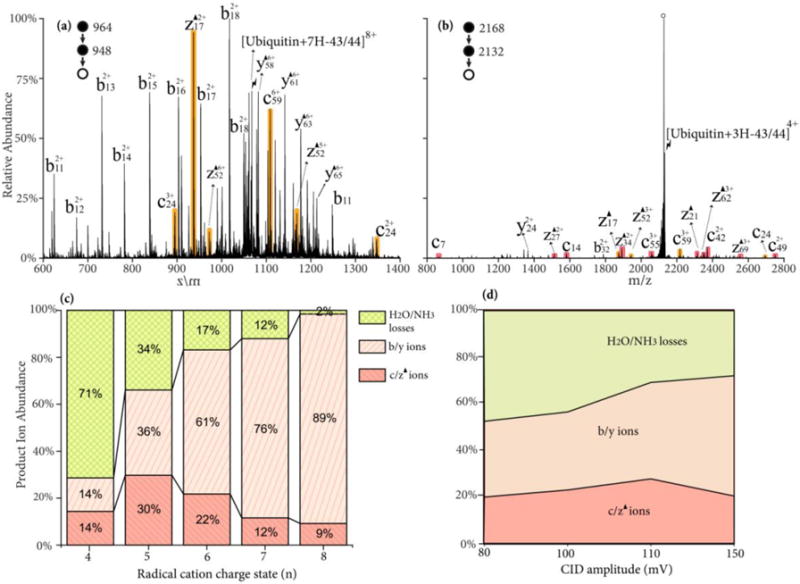
Figure 5.

CID spectrum of radical side chain loss from ubiquitin radical cation (a) [ubiquitin+7H-43/44]8+; (b) [ubiquitin+3H-43/44]4+ at 110 mV for 100 ms; (c) Product ion partitioning at different charge states of radical cations; (d) Product ion partitioning of [Ubiquitin+4H-43/44]5+ at different CID energies. Red, orange shaded peaks indicate c- and z-fragments N-terminal to leucine and asparagine. Black triangles indicate fragment ions containing a Dha residue and degree signs indicate water losses. Lightning bolts indicate species subjected to activation.
