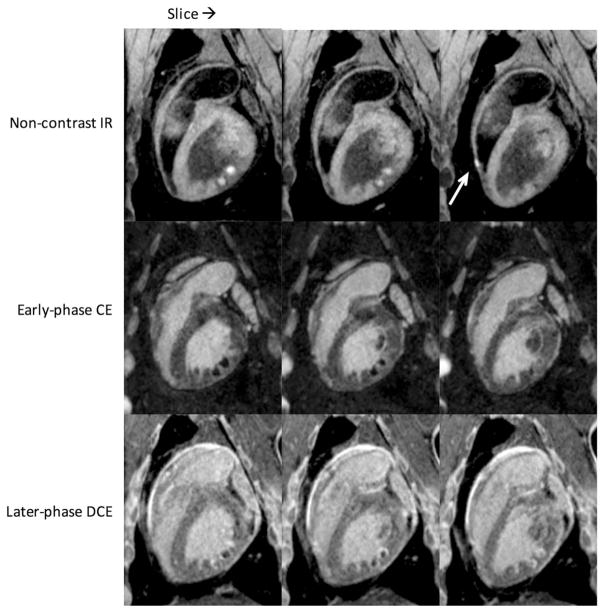
FIG. 5.
Consecutive slices from endocardial ablation study showing multiple lesions in the LV (opposite RV) and one in the RV (arrow). Native enhancement is visible even in thin RV wall. The top row is non-contrast-enhanced T1w with TI =700 ms; middle row is early-phase contrast enhancement with TI =300 ms, sequence starting 1 min after contrast injection; bottom row is the same 20 min later (DCE). Note the changing appearance of the lesions from early to later-phase contrast enhancement. A rotating 3D volume rendering of the T1w images from the top row is provided in Supporting Video S1.

