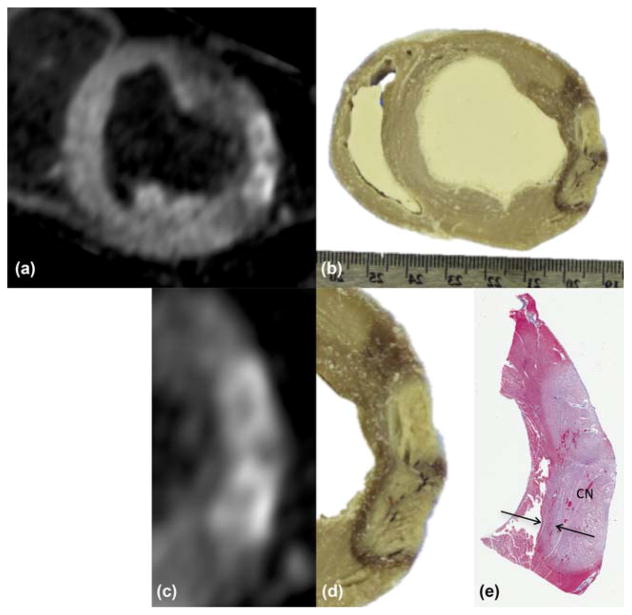
FIG. 7.
(a) Multiplanar reformat of images from previous figure, showing short-axis view through lesions in zoom inset of Figure 6b. (b) Photograph of tissue slice through same lesions, showing correspondence. (c, d) Zoom of subregion from (a) and (b). (e) Corresponding tissue slice after Masson’s trichrome stain. Lighter region indicates coagulation necrosis (CN) at lesion core; arrows denote transition band of CBN or hematoma.

