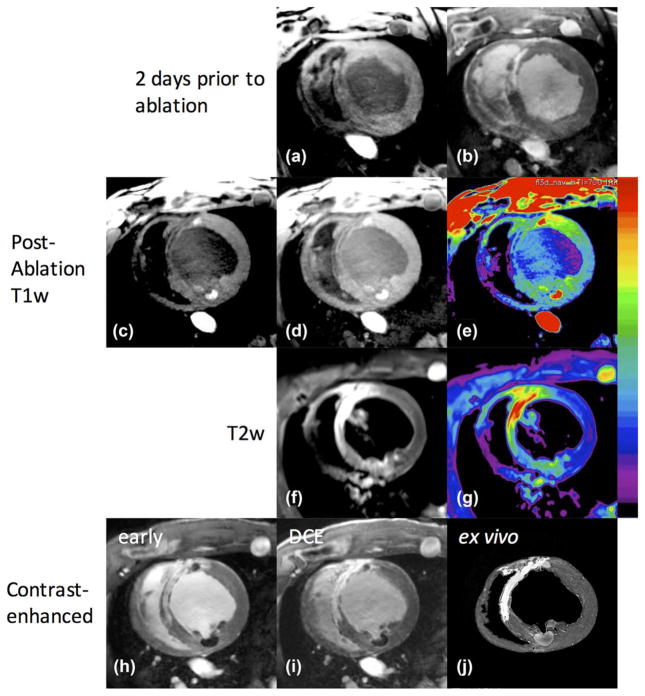
FIG. 9.
Images of infarcted animal before and after endocardial ablation. Two days before ablation: scar is hypointense in T1w (a), and enhanced in DCE (b). After ablation: (c) T1w with window level adjusted for viewing of normal and ablated myocardium, lesion core enhancement seen at approximately 11:00 in a region containing scar, and 5:00 in a normal region; (d) brightness increased to show hypointense regions of scar; (e) color map applied for better visualization of scarred (low dynamic range), normal, and ablated regions (high dynamic range). (f) T2w images acquired with TIRM sequence; (g) color map applied for better visualization of T2 enhancement in scar (yellow/red), and lower, less-selective enhancement of lesion core and surrounding edematous area (green). (h) Early contrast enhancement showing scar regions enhanced and lesion cores unenhanced, whereas delayed imaging (i) shows contrast agent entering the lesion cores. (j) Ex vivo images corroborate scar and ablation locations.

