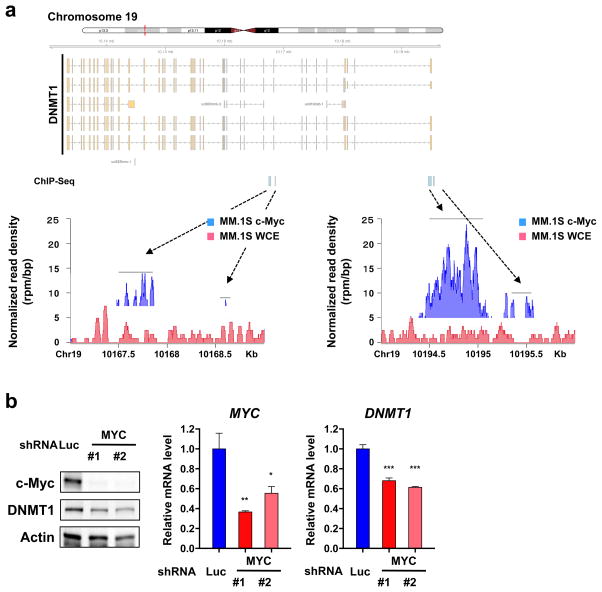
Figure 3. c-Myc regulates DNMT1 in MM cells.
(a) Publicly available ChIP-Seq data (GSE36354) were analyzed for the distribution of c-Myc binding at the DNMT1 locus in MM.1S cells. The x axis shows genomic position. The y axis shows signal strength of c-Myc binding (rpm/bp). WCE; whole cell extract (b) MM.1S cells were transduced with either MYC-specific shRNA (shMYC #1 and #2) or shLuc by lentivirus. Whole cell lysates and total RNAs were extracted from the transduced cells. The lysates were subjected to immunoblot analysis. A served as a loading control. Q-PCR of MYC and DNMT1 was performed. Values represent the amount of mRNA relative to shLuc, defined as 1. Error bars represent s.d. of triplicate measurements. Data are representative of at least two independent experiments. *P < 0.05, **P < 0.01, ***P < 0.001 compared with control; Student’s t-test.

