
Figure 5.
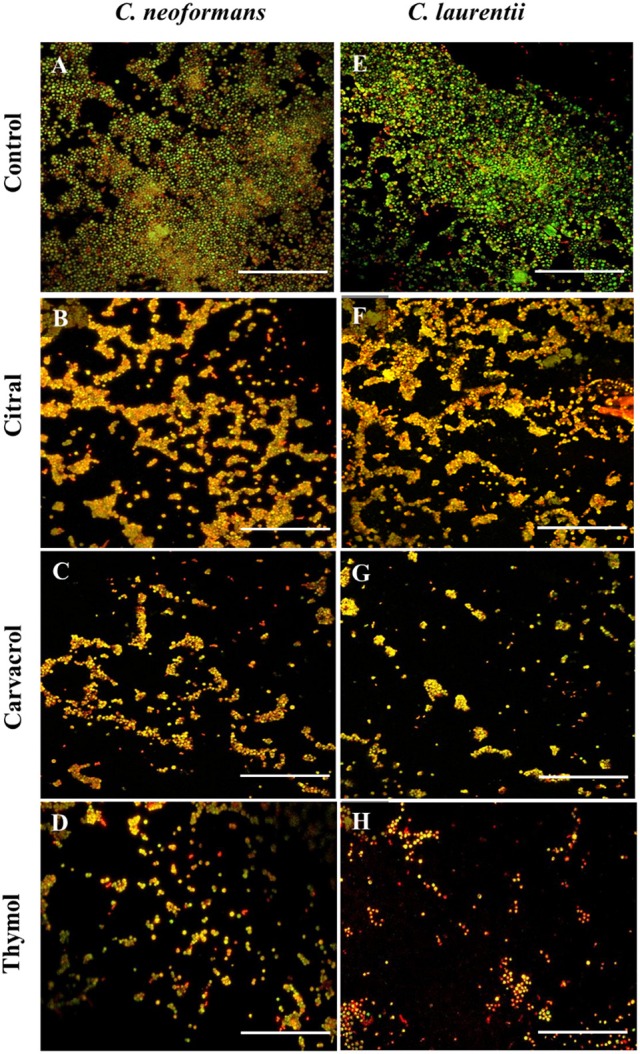
Confocal laser scanning microscopic images of C. neoformans and C. laurentii biofilms formed before and after treatment with EO-ACs. (A,E) Control (1% DMSO) (B–D) 32 μg/ml of citral, carvacrol and thymol (F–H) 16 μg/ml of citral, carvacrol and thymol. In the control panels, images of biofilm showed metabolically active (red, FUN-1-stained) cells embedded in the EPM (green, CAAF- 488 -stained). In the citral, carvacrol and thymol treatment panels, the yellow-brownish region represents metabolically non-viable cells. The images were taken by using 40X power field. Scale bar 50 μm.