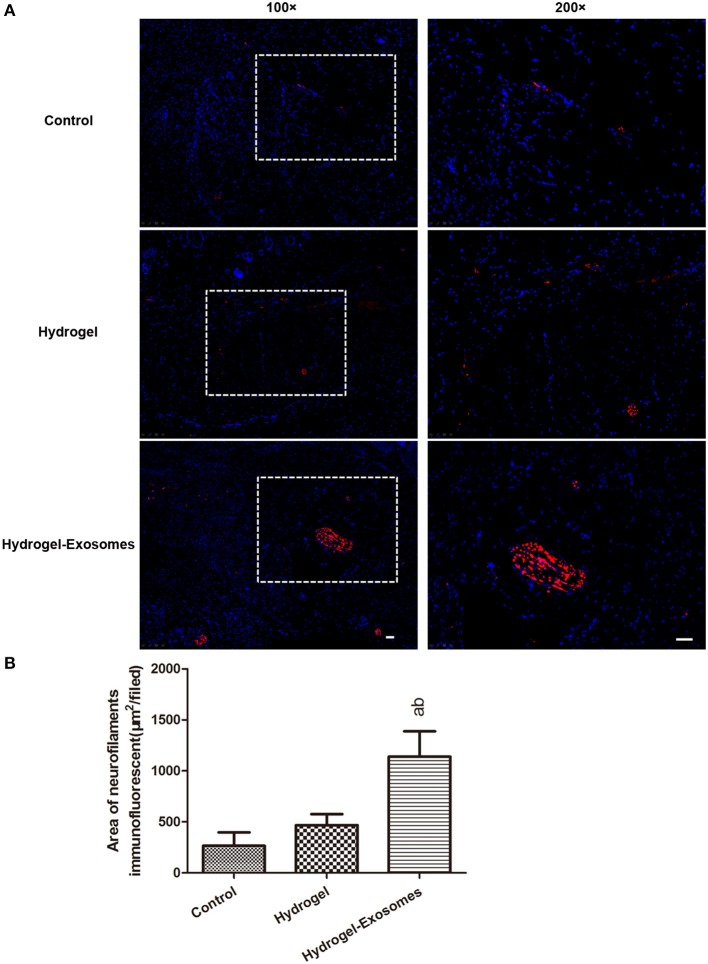
Figure 10.
Immunofluorescent analysis of nerve fiber density at 2 weeks post-surgery. (A) Representative immunofluorescent images of neurofilament heavy chain (red fluorescence) were detected at 2 weeks post-surgery. Nuclei were stained with DAPI (blue fluorescence). The 200× image is the magnified view of the area denoted by the dashed boxes in the 100× image. Scale bar: 50 μm. (B) Quantitative analysis of the nerve fiber density in each group at 2 weeks post-surgery. a, P < 0.05 compared to the control group; b, P < 0.05 compared to the hydrogel group.

