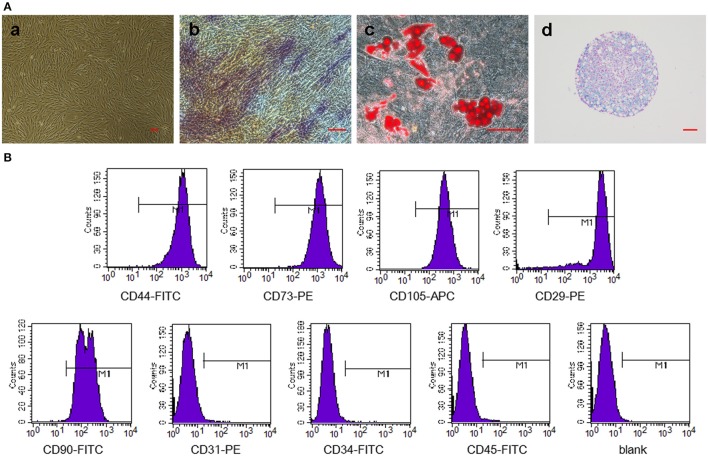
Figure 2.
Characterization of GMSCs and in vitro multipotent differentiation. (A) Representative images of GMSCs at passage 3 (a). Representative images of osteogenesis (b), adipogenesis (c), and chondrogenesis (d) of GMSCs stained with alkaline phosphatase, Oil Red O and Alcian blue, respectively. Scale bar: 100 μm. (B) Flow cytometric analysis of surface markers in GMSCs.

