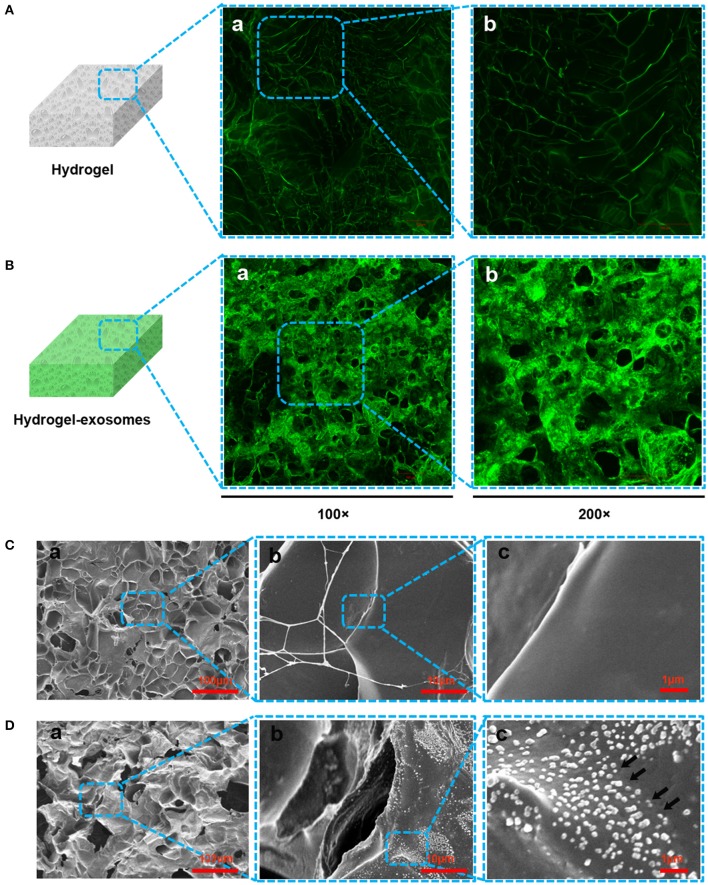
Figure 5.
Detection of exosomes on the hydrogel sponge. (A) LSCM images of the hydrogel sponge. (a: 100×; b: 200×). (B) LSCM images of the hydrogel sponge with DiO-labeled exosomes. (a: 100×; b: 200×). Scale bar: 100 μm. (C) SEM images of hydrogel surface (a: 100×; b: 1,000×; c: 6,000×). (D) SEM images of hydrogel surface after adding the exosomes (a: 100×; b: 1000×; c: 6000×). The black arrows show the exosomes.

