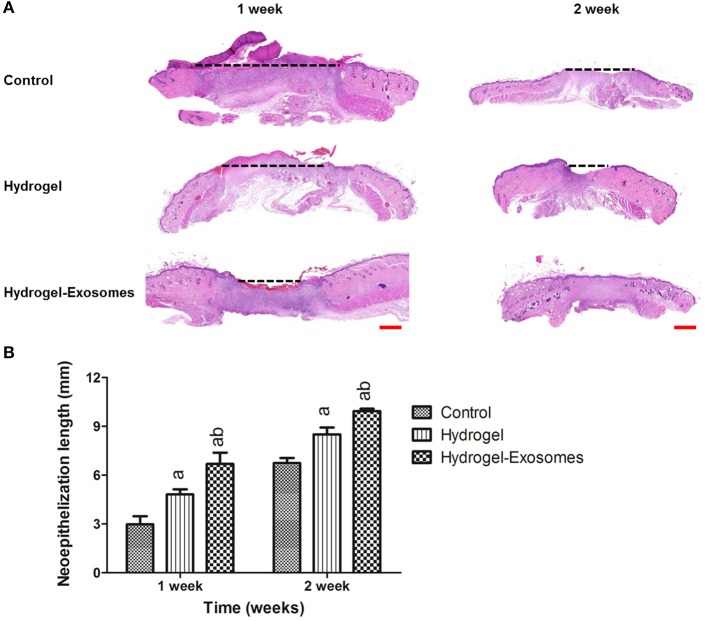
Figure 7.
H&E staining of the wound sections and quantitative analysis of the neo-epithelium. (A) Representative images of H&E staining of the wound section in each group at 1 week and 2 weeks post-surgery. The black dotted line indicates the length without re-epithelialization in the wound. Scale bar: 1 mm. (B) Quantitative analysis of the total length in the three groups at each time point. a, P < 0.05 compared to the control group; b, P < 0.05 compared to the hydrogel group.

