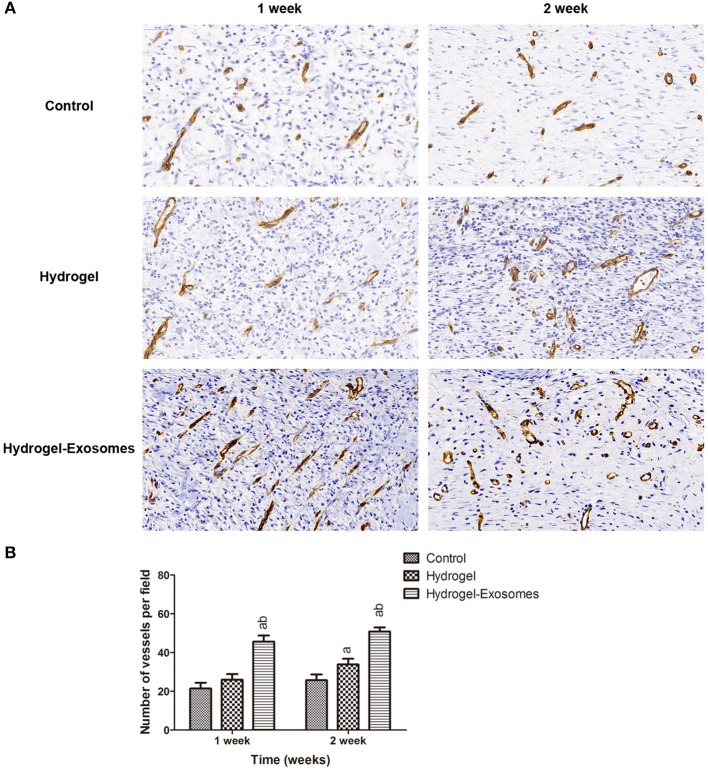
Figure 9.
Immunohistochemical analysis of angiogenesis. (A) Representative images of immunohistochemical staining of CD34 in each group at 1 week and 2 weeks post-surgery (400×). Scale bar: 50 μm. (B) Quantitative analysis of the number of microvessels per field in each group at 1 week and 2 weeks post-surgery. a, P < 0.05 compared to the control group; b, P < 0.05 compared to the hydrogel group.

