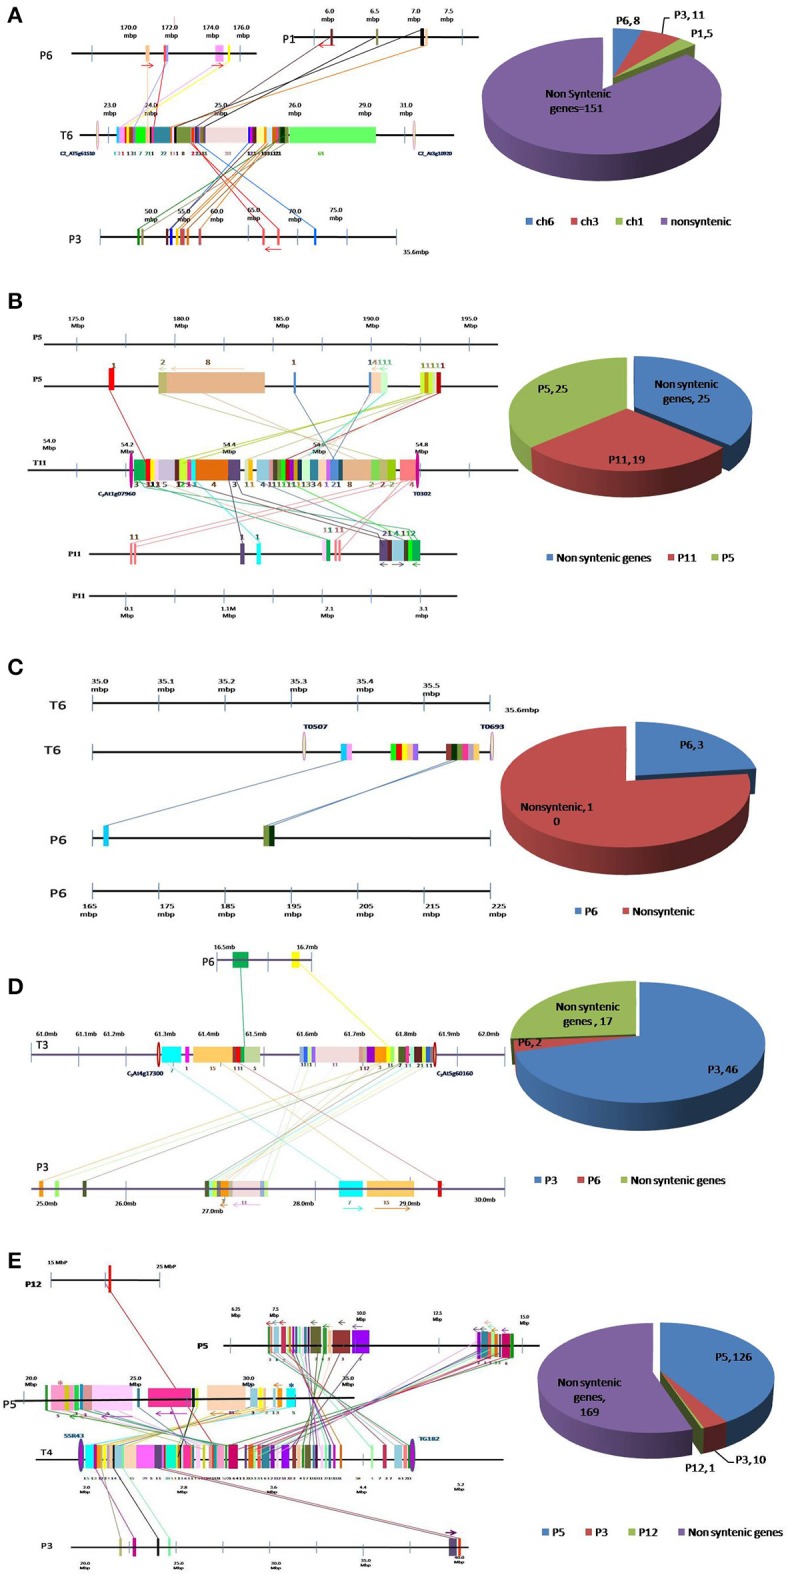
Figure 1.

Conservation and dispersion of genes located in (A) Ty1, (B) Ty2, (C) Ty3, (D) Ty4, and (E) ty5 QTL regions of tomato and orthologous regions from pepper. The region on the left represents synteny and micro-collinearity between tomato Ty QTL region and orthologous regions in pepper. The chromosomal regions are represented by horizontal lines, whereas, vertical bars represent genes. The tomato chromosome number is indicated with “T” followed by number, whereas pepper chromosome number is indicated by “P” followed by number. Orthologous genes are shown by same color bar and are joined through a line. The arrows indicate change in orientation of genes in pepper genome. The region on the right presents distribution of syntenic and non-syntenic orthologs identified in pepper. Numbers of non-syntenic genes and syntenic genes found on each chromosome are given.
