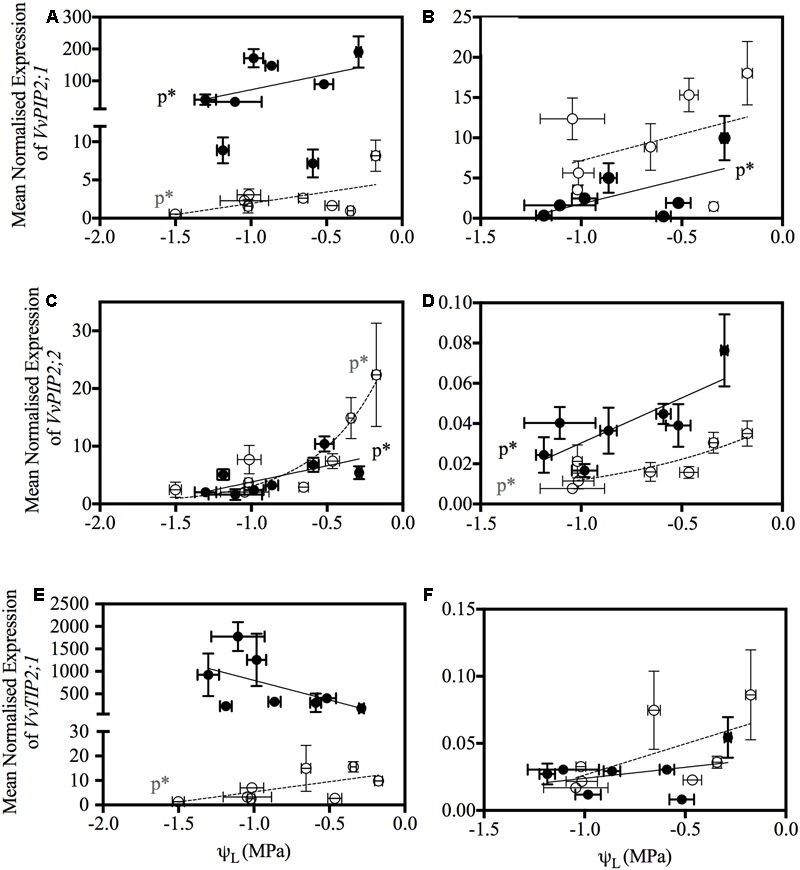
FIGURE 7.

Relationship between aquaporin gene expression and leaf water potential (ψL) in Chardonnay (open gray circles, dotted line) and Grenache (filled black circles, bold line) petioles and leaves. Expression of VvPIP2;1 in petioles (A) and leaves (B), VvPIP2;2 in petioles (C) and leaves (D) and VvTIP2;2 in petioles (E) and leaves (F). Only gene expression data that had a significant Pearson correlation with ψL are shown. Significance is indicated by p∗.
