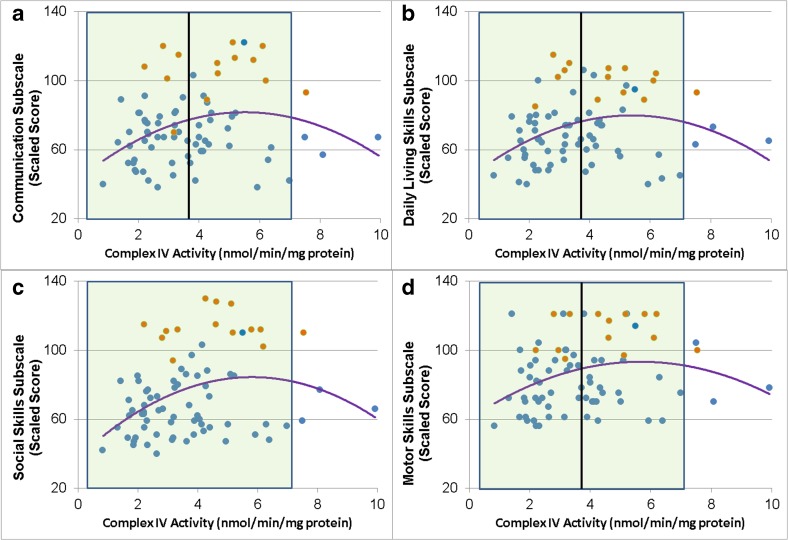
Fig. 3.
Vineland Adaptive Behavior Scale subscales are related to uncorrected Complex IV activity. Shaded area represents the normal range with the vertical black line representing the mean of the control group. Blue points represent children with ASD while the orange points represent typically developing control children

