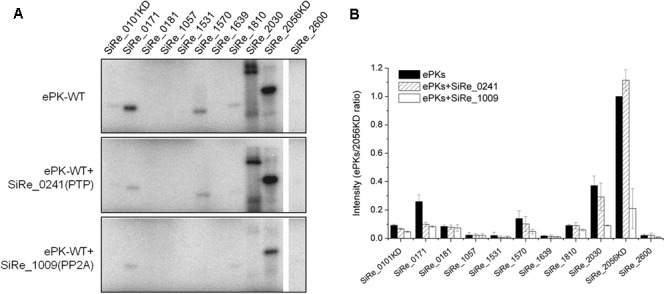
FIGURE 3.

Dephosphorylation of the autophosphorylated S. islandicus ePKs by two protein phosphatases (PPs), SiRe_0241 (protein tyrosine phosphatase, PTP) and SiRe_1009 (phospho-Ser/Thr phosphatase, PP2A). (A) Representative profiles of the phosphorylation (upper panel) and dephosphorylation reactions (middle and lower panels). For the dephosphorylation reactions, each ePK (1 μM) was incubated with one of the two PPs in a reaction at 65°C and the samples were analyzed by 12% SDS-PAGE. The experiments were performed for at least three times. Representative images of ePKs autophosphorylation (upper panel), dephosphorylation by SiRe_0241 (middle panel) and SiRe_1009 (lower panel) are shown. (B) Quantitative results of the autoradiographs in (A). The signals of each ePK are normalized to the autophosphorylation signal of SiRe_2056KD. The bars indicate standard deviation.
