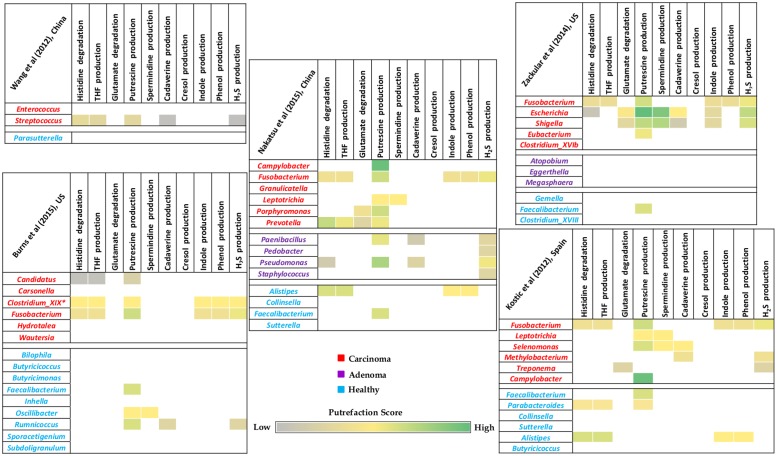
FIGURE 5.
Putrefaction capabilities of differentially abundant genera in gut microbiome of healthy and colorectal cancer patients. Heatmaps representing distribution of selected putrefaction pathways (associated with production of harmful compounds) in the differentially abundant genera in one of the cohorts (carcinoma/adenoma/healthy) with respect to the other(s). Each cell represents the ‘Pfacs’ (Putrefaction score) of the corresponding pathway in that particular genus. ‘Pfacs’ indicates the relative putrefaction capabilities of any genus, evaluated based on the number of constituting putrefying strains and the database size of the respective genus.

