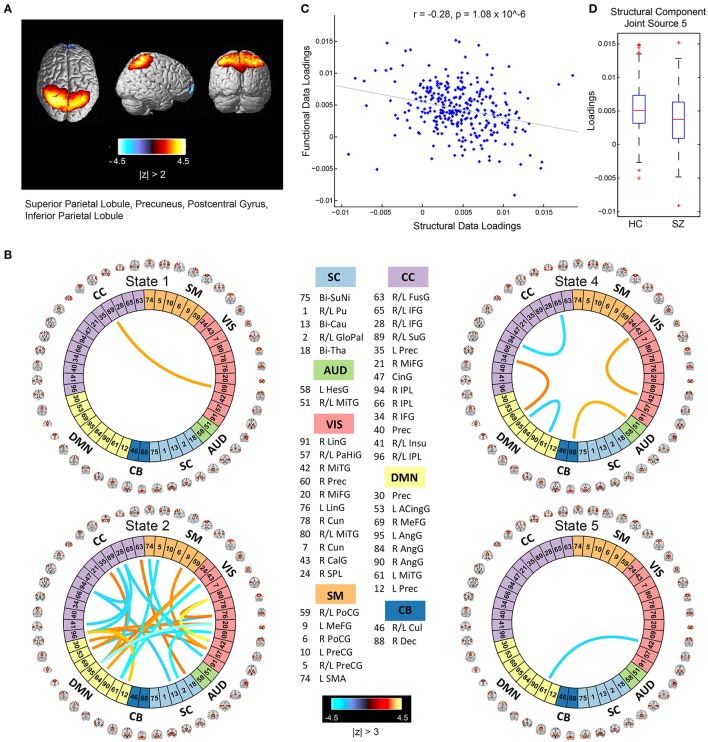
Figure 3.
Joint Source 1. (A) Spatial maps of the most activated regions for the structural component in the first joint source; (B) A visualization of significant links (functional connections with highest connectivity strengths i.e., with z-scores of connectivity strengths: |z| > 3) and their connectivity strengths for the functional component in the first joint source; (C) Scatterplot of the functional data loadings with the structural data loadings revealed a significant correlation (r = −0.28, p = 1.08 × 10⁻⁶); and (D) The group mean for the loading parameters was significantly lower for participants with schizophrenia, thus suggesting significant reductions in gray matter volume for this structural component.

