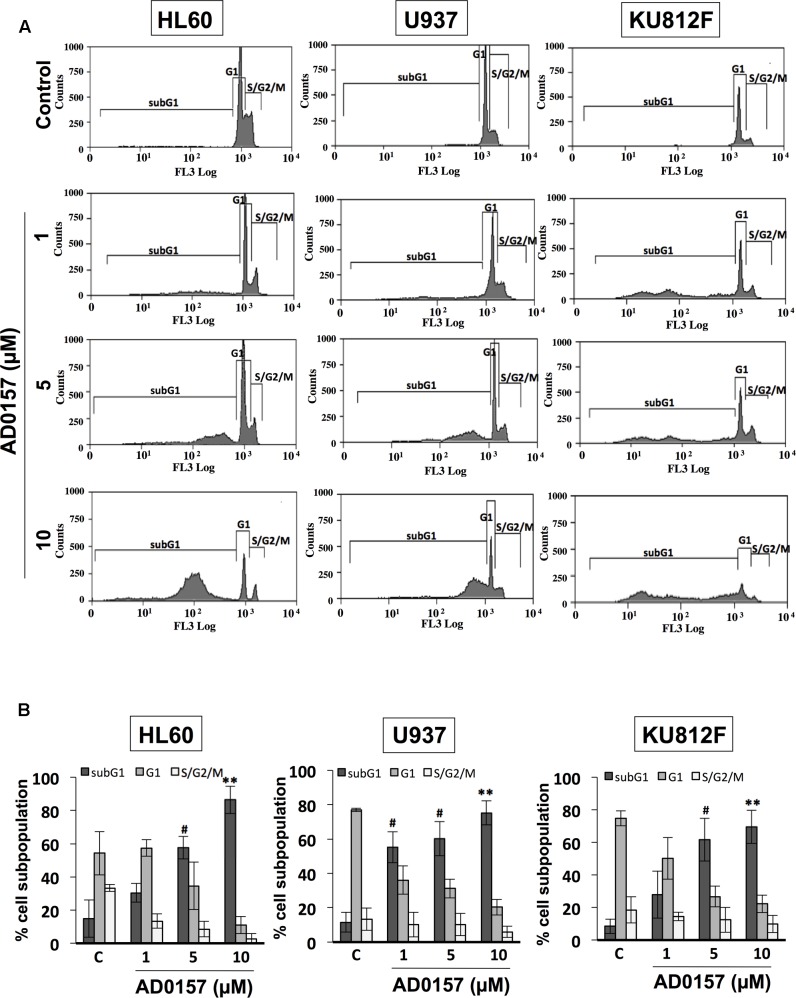
FIGURE 3.
AD0157 induces increases in the subG1 population of myeloid leukemia cells. (A) Representative flow cytometry histograms showing the effect of AD017 on HL60, U937 and KU812F cell cycle distribution. Leukemia cells were exposed for 14 h to AD0157 at the indicated concentrations, stained with propidium iodide and percentages of subG1, G1, and S/G2/M cells were determined using a MoFlo DakoCytomation cytometer. (B) Graphs correspond to the distribution of cell subpopulation percentages expressed as means ± SD of three independent experiments. #p < 0.005 and ∗∗p < 0.001 versus untreated cells.

