Figure 1.
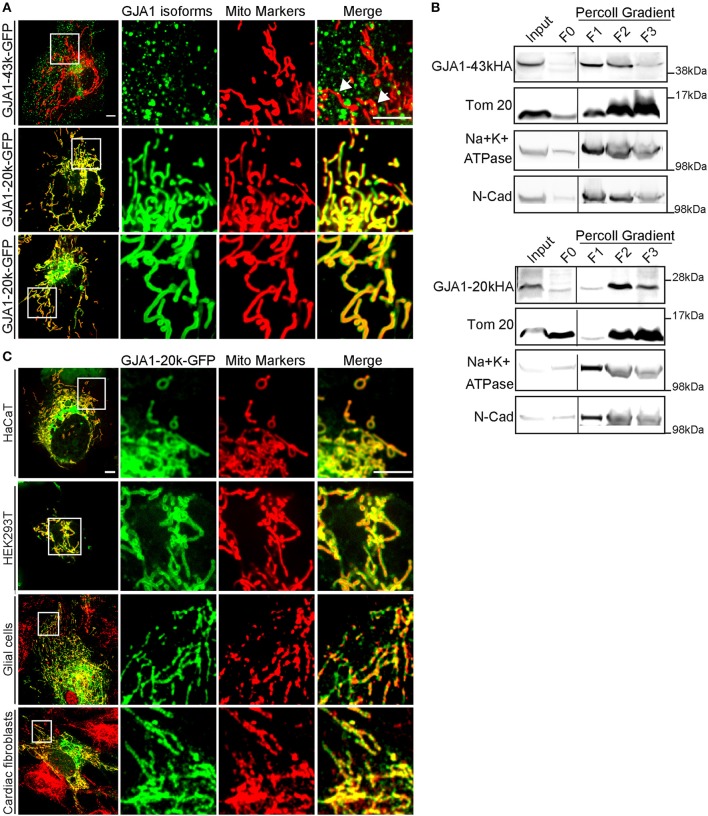
GJA1-20k delineates the mitochondrial network. (A) Imaging of live HeLa cells expressing GFP-tagged GJA1-43k or GJA1-20k (green) and mitochondrial markers (red). GJA1-43k associates with mitochondria as small puncta (arrows). GJA1-20k colocalizes with mito-BFP (middle panel) and TMRM (bottom panel). Scale bar = 5 μm. (B) Relative enrichment of HA-tagged isoforms in total cell lysate (input), the cytosol supernatant (F0), and membrane fractions of crude mitochondrial pellet (F1–F3). Mitochondria (Tom20). Plasma membrane (Na+K+ATPase, N-cadherin). Full blots were in Figures S7, S8. (C) Live cell imaging of HaCat and HEK293T cells cotransfected with mito-BFP and GJA1-20k-GFP. Immunofluorescence of GFP and Tom20 in primary glial cells and cardiac fibroblasts transfected with GJA1-20k-GFP. Scale bar = 5 μm.

