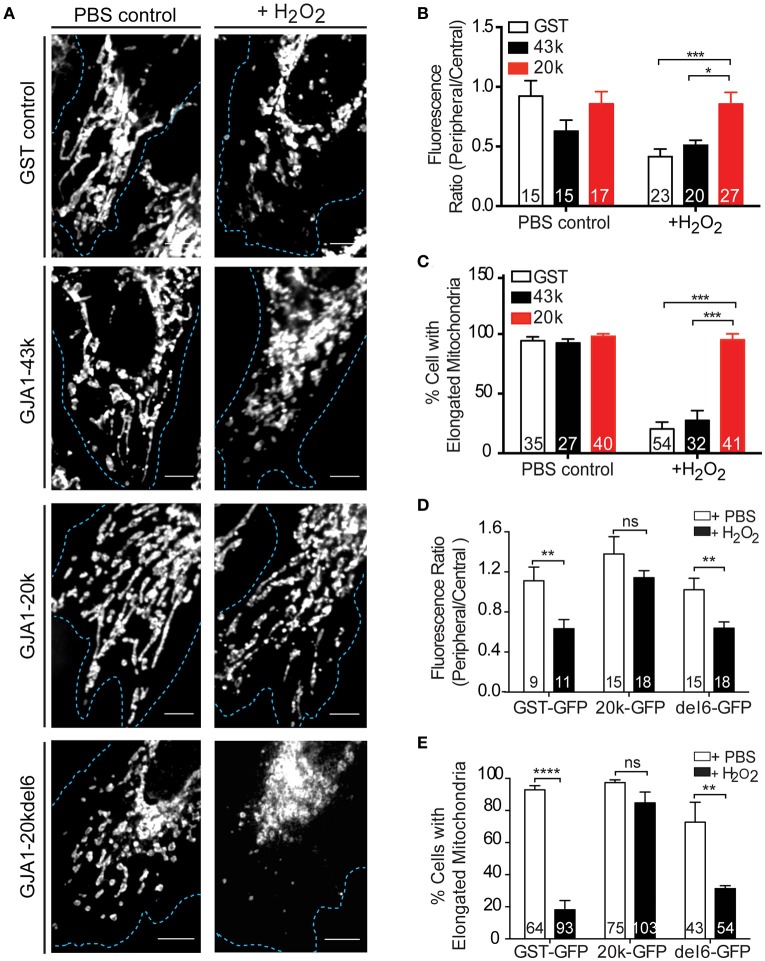
Figure 4.
GJA1-20k limits mitochondrial fragmentation upon oxidative stress. (A) Mitochondria morphology and distribution (Tom20) in HeLa cells expressing GFP-tagged GST, GJA1-43k, or GJA1-20k, or GJA1-20kdel6 treated with PBS or 300 μM H2O2. Cell borders (blue). Scale bar = 5 μm. See also Figure S6. (B) Periphery versus cell center Tom20 fluorescence intensity and (C) percentage of cells containing elongated mitochondria comparing GFP-tagged GST, GJA1-43k and GJA1-20k. (D) Peripheral vs. central mitochondria (Tom20) (See Figure S10) and (E) percentage of cells with elongated mitochondria comparing GFP-tagged GST, 20k, 20k-del6 in PBS or H2O2. All data are mean ± SEM (n = 4 repeats), *p < 0.05, **p < 0.01, ***p < 0.001, ****p < 0.0001, two-way ANOVA, Tukey's post-hoc-test.

