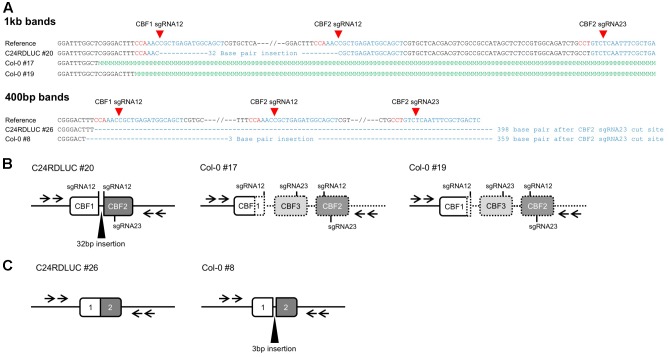
FIGURE 3.
Various mutations found in T1 plants. (A) Alignments of sequences of the PCR product from T1 plants and the reference sequence. Red sequences indicate the PAM sequence, blue sequences denote the sgRNA sequences and the green “M” sequences mean multiple peaks shown in sequence electropherogram. (B) Drawing of the CBF123 deletion that will give rise to about 1 kb product from PCR with primers indicated by arrows. The drawings in dotted line indicate DNA regions with multiple sequencing peaks due to genetically mosaic T1 leaf tissues. (C) Drawing of the CBF123 deletion that will give rise to about 400 bp product from PCR with primers indicated by arrows.

