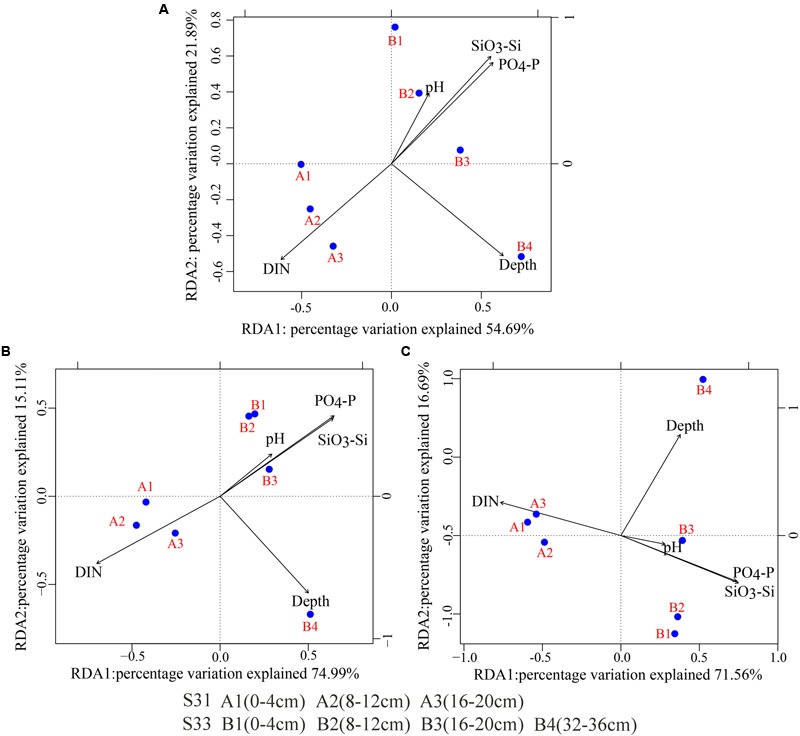
FIGURE 8.

Redundancy analysis (RDA) biplot of environmental parameters and the 16S rRNA and functional genes (dsrB and soxB). (A) 16S rRNA; (B) dsrB; (C) soxB.

Redundancy analysis (RDA) biplot of environmental parameters and the 16S rRNA and functional genes (dsrB and soxB). (A) 16S rRNA; (B) dsrB; (C) soxB.