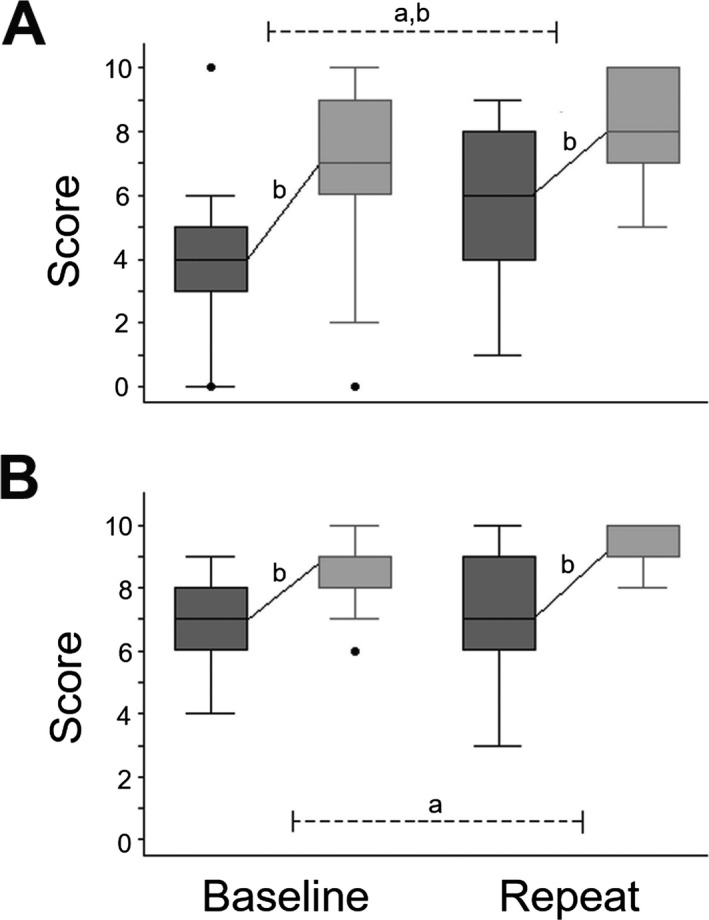
Figure 2.

Profiles of sinewave speech comprehension by the participant groups are shown for baseline and repeat behavioral test sessions (see also Table 1). A: Alzheimer's disease; B: Healthy controls. For each group and test session, dark gray oblongs code interquartile range and whiskers the overall range of scores for the first 10 trials; light gray oblongs code interquartile range and whiskers the overall range of scores for the second 10 trials; solid lines indicate the mean change in scores between trial blocks in each test session; and dotted lines indicate comparisons between sessions. Values falling outside these ranges are indicated. aSignificant between‐group difference (P < 0.05); bsignificant within‐group change (P < 0.05).
